Flow tells you who talked. Netalyze shows what they said.
Your routers already sample packets. Netalyze reads the headers and the first bytes of payload of each sample, names the protocol by its content, and points out the exposed services, scans and exploitation attempts inside your network. No probes, no taps, no agents.
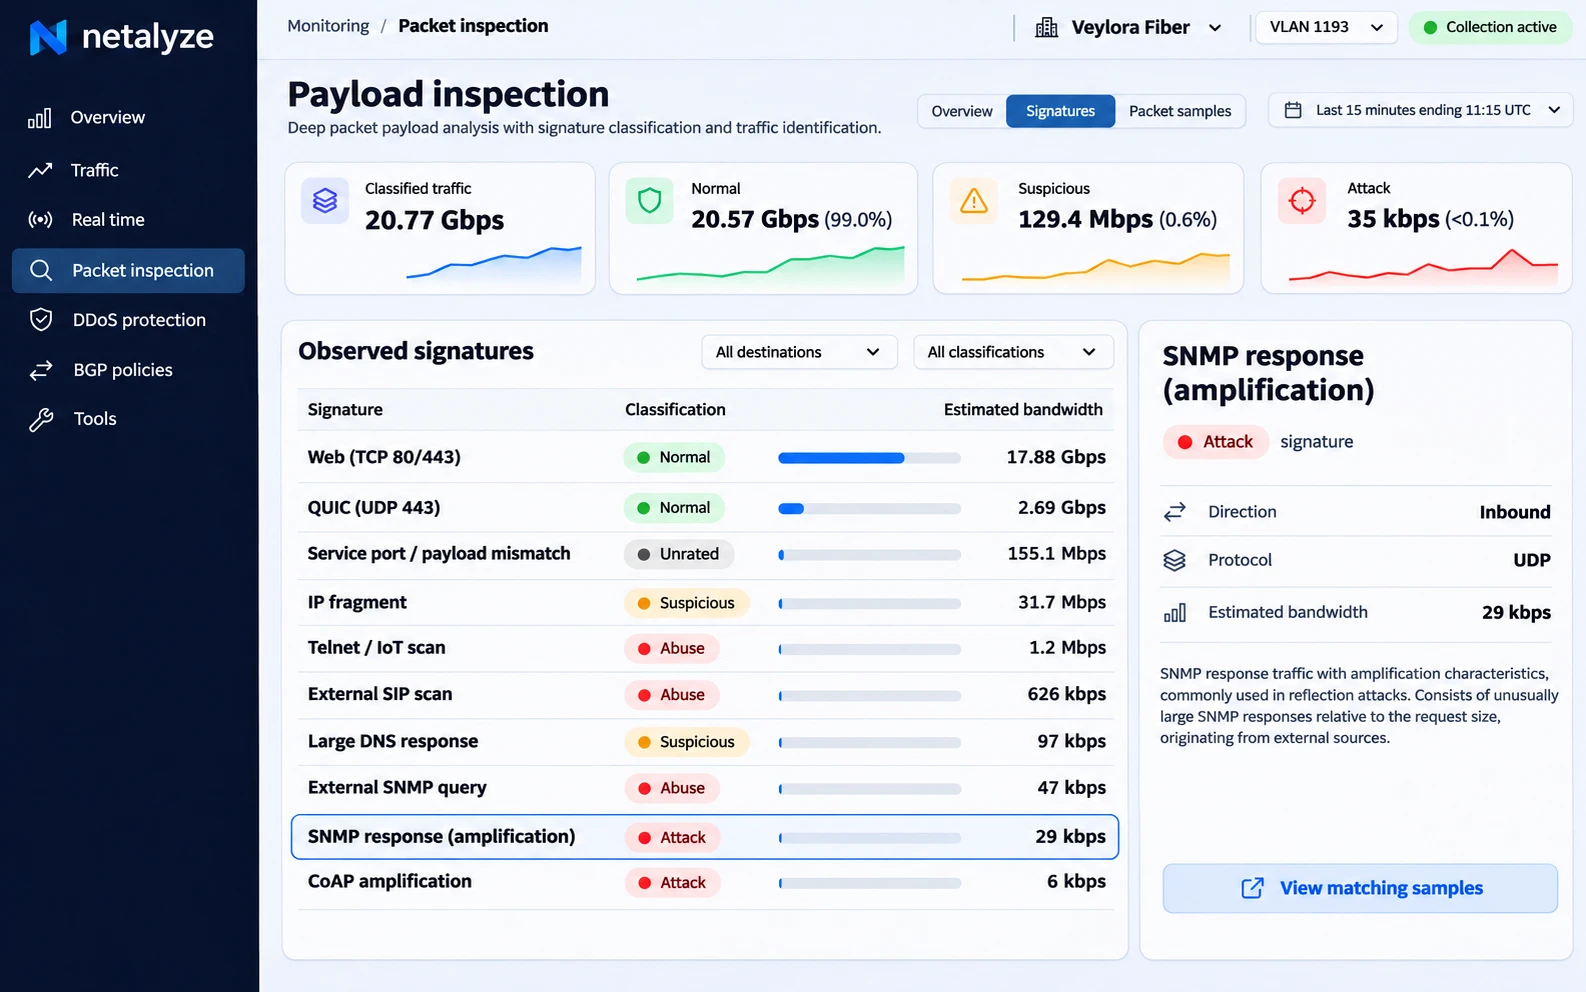
A port says what traffic should be. The payload says what it is.
Flow records stop at addresses, ports and byte counts. Netalyze also checks the protocol header inside each sampled packet. A protocol only gets its name when its header matches, so you stop guessing from port numbers.
UDP 53 · 1.2 GbpsLooks like DNSUDP 10001 · 300 MbpsLooks like Ubiquiti discoveryUDP 53 → your resolverNormal DNS queriesUDP 123 · small packetsTime syncTCP 80 · 4 GbpsWeb trafficSee your traffic as it happens, not five minutes later
Most flow tools show you averages of the last few minutes. Netalyze opens a live view of any customer, VLAN, block or single IP, refreshed every 5 seconds, down to each connection. When something changes, you see it while it is still changing.
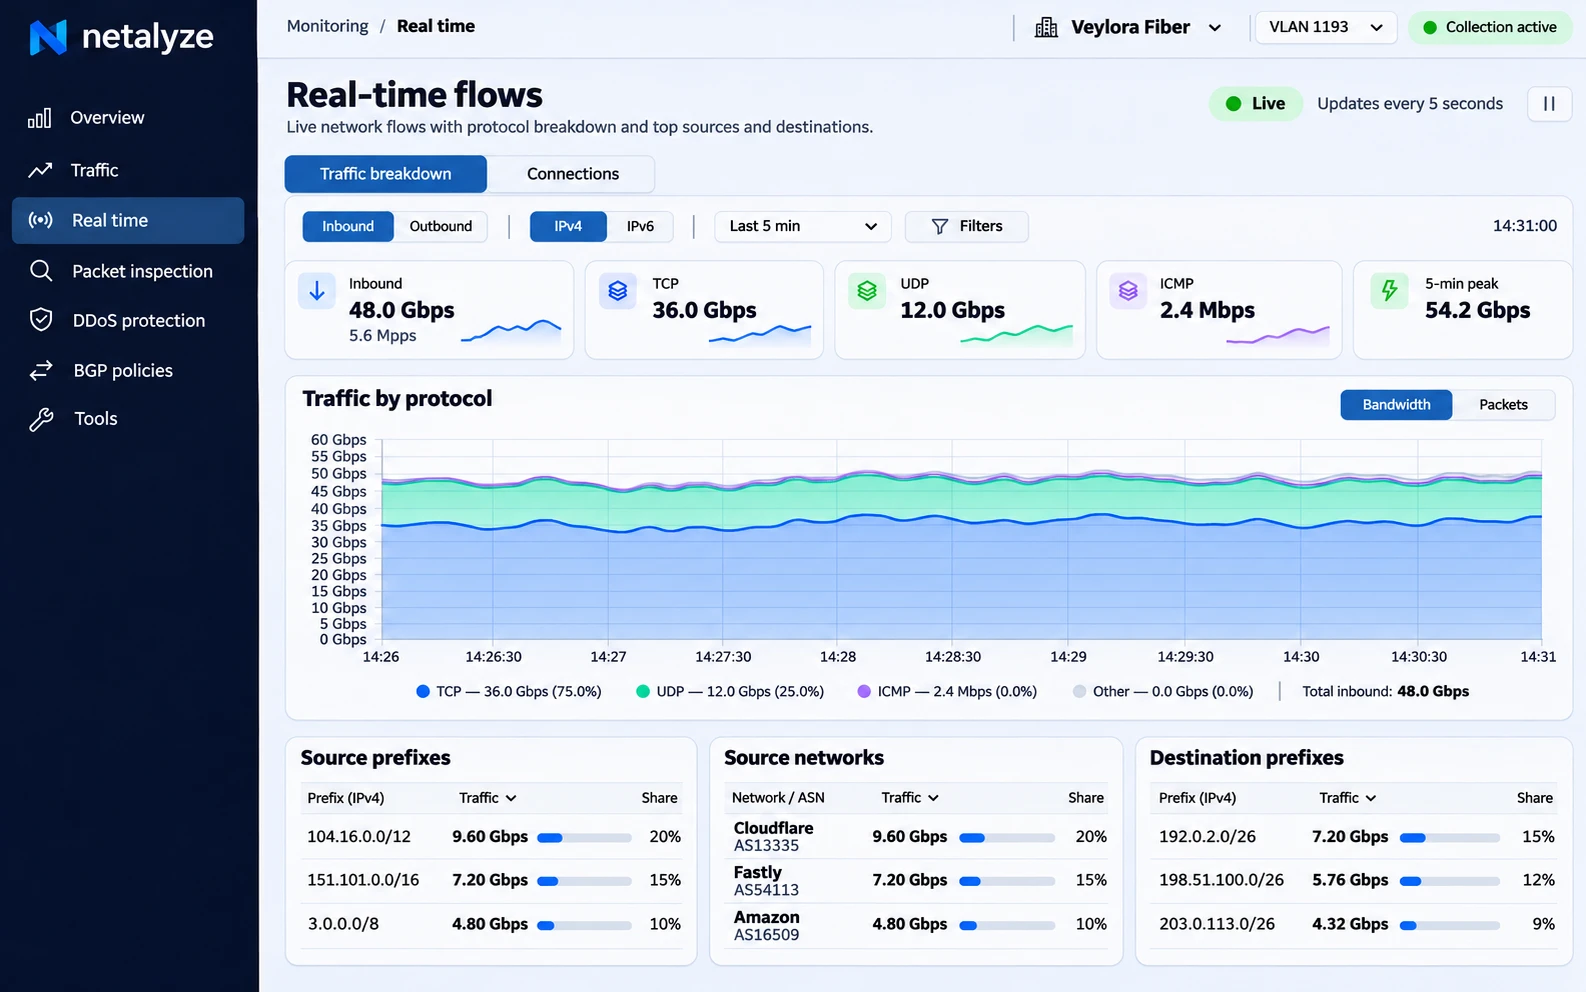
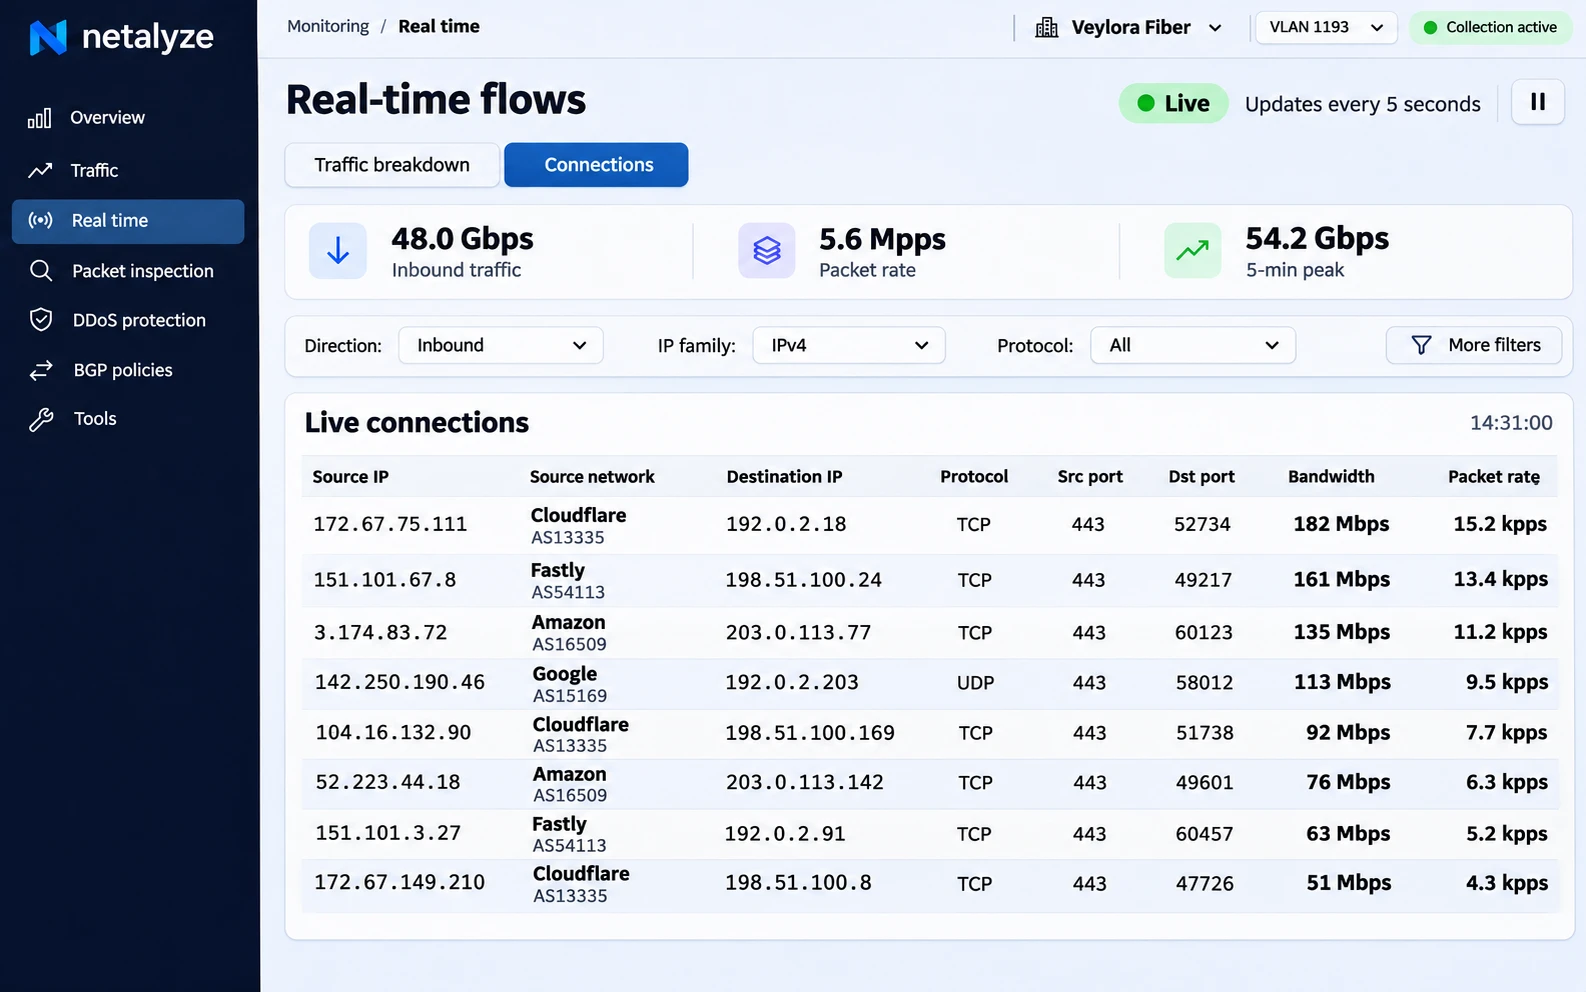
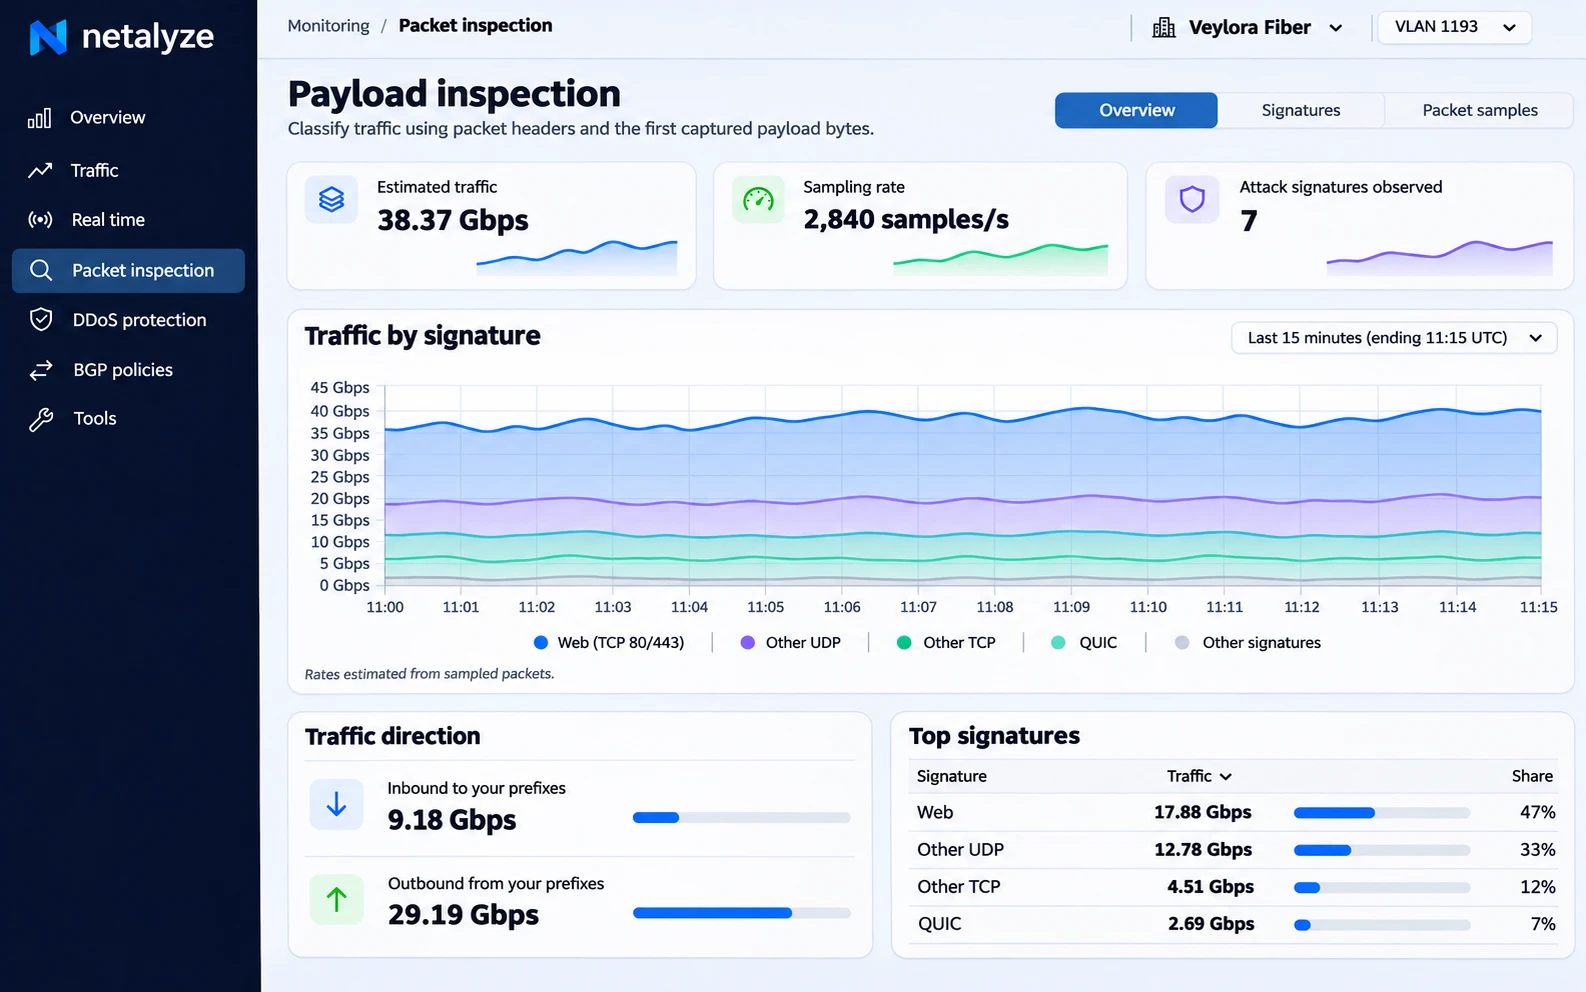
From the packet up to the whole network
Pick a customer and a VLAN at the top. Every screen follows that choice: signatures, sample decoding, live flows and the overall picture.
Find the weak spots in your network without scanning it
Every device that answers the wrong question shows up in the traffic. Netalyze maps these services passively, from what your routers already see, and tells you which IP needs attention.
Open DNS resolvers
AbuseResolvers answering queries from the whole internet, often ANY queries with large EDNS replies.
SNMP with "public"
AbuseRouters, ONUs and switches replying to SNMP requests that come from outside your network.
Legacy NTP and memcached
SuspiciousServers still answering NTP monlist, memcached over UDP, SSDP or CLDAP, the services most used for amplification.
Management open to the world
SuspiciousTelnet, SSH and web panels on CPEs and servers receiving connections from abroad.
Sites without TLS
UnratedHost names still served over plain HTTP, readable by anyone on the path.
Unexpected protocols
UnratedCrypto mining pools, P2P and tunnels on service ports, coming from inside your customer base.
See who is probing your network, and how
Scans and exploitation attempts come before most incidents. Netalyze shows the source, the target and what was sent.
Port and service scans
Sources sending SYN to five or more of your IPs, with the ports they tried.
IoT and Telnet botnets
Login attempts on ports 23 and 2323 looking for cameras, DVRs and routers with default passwords.
SIP and VoIP scans
OPTIONS and REGISTER requests from outside, hunting for PBXs to make fraudulent calls.
SSH and SNMP probing
Repeated SSH handshakes and SNMP queries with common communities, by source.
Spoofed sources
One source address arriving with six or more different TTLs: the address is forged.
DNS, decoded
| Name | Seen | Why |
|---|---|---|
| x7kq2vd9a1.example-cdn.com | 1,204 | Random subdomain |
| qhzlwpxmro.top | 388 | Looks like DGA |
| isc.org · ANY | 312 | From outside |
| update.example.net | 96 | High NXDOMAIN |
| www.google.com | 18,550 | Normal |
Example data. Domain names generated by malware (DGA) and random-subdomain floods stand out from your customers' normal browsing.
When traffic jumps, know if it is an attack and if it can be filtered
Netalyze compares the moment with the same time yesterday and looks inside the packets for what changed. You get an answer you can act on, not just a red graph.
Detect
Traffic goes above the customer's own normal, learned from the last 7 days.
Compare with yesterday
Same time, one day earlier: which protocols, ports, packet sizes, TTLs and source networks are new.
Find the signature
The fields that appear in the attack and not in normal traffic, with how much of each a rule would catch.
Decide
A clean signature becomes a filter on your routers. If the attack looks like normal traffic, Netalyze says so and suggests a rate limit per destination instead.
Attack now · 203.0.113.0/24
NTP amplificationudpsource-port 123length 468NTP mode 7From a sampled packet to a finding
Nothing is installed in your network. The routers you already run do the sampling.
Sample
Juniper inline monitoring sends the start of each sampled packet: headers plus the first payload bytes.
Decode
IP, TCP and UDP headers, TTL, IP ID, flags and size, then the application header inside the payload.
Classify
Each sample is checked against protocol signatures. Port without a matching header is marked unrated, never guessed.
Report
Findings by IP and by customer, with example samples and a hex dump you can show to whoever needs to fix it.
The full picture of your traffic
IPFIX, NetFlow and sFlow by AS, prefix, country, port, interface and next hop, IPv4 and IPv6.
Each customer signs in and sees only their own prefixes, traffic and findings.
Customers choose full, partial or default routes, prepends and peering communities themselves.
Each user decides who gets a message when an attack starts and ends.
Find out what is really crossing your network
Enable inline monitoring on one Juniper router and we'll walk you through the first findings: exposed services, scans and anything that doesn't match its port.